Overview
We will thoroughly understand AI CNN from the basics to practice.
We will understand the mechanisms such as how artificial neurons and neural networks, which are the basis of AI, operate.
You will also program a convolutional neural network and understand its model and mechanism.
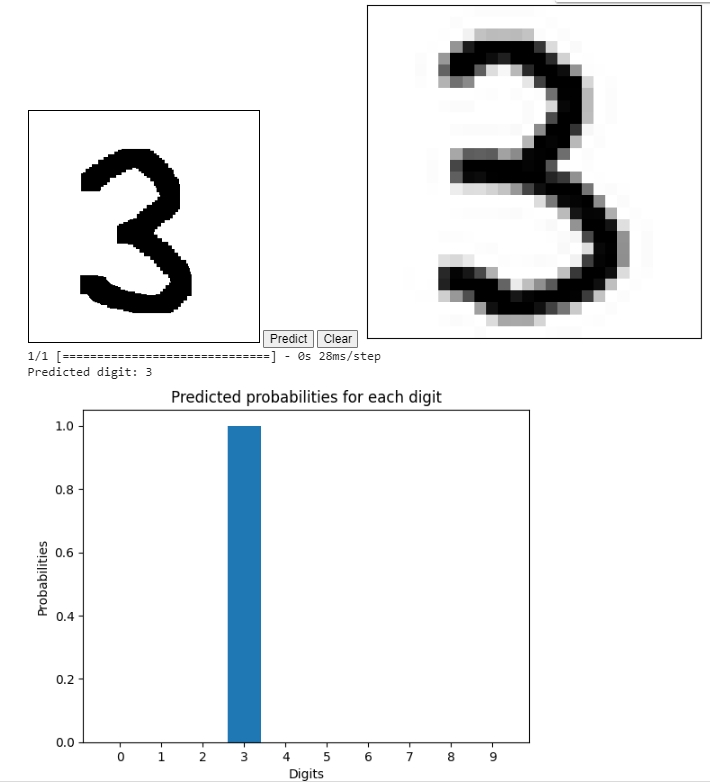
Finally, we will use Google Collaboratory and MNIST data to practice the recognition and judgment of mouse handwritten characters.
Video
Japanese【日本語】
English
Python Program
MNIST data display program
# 必要なライブラリのインポート
import numpy as np
import matplotlib.pyplot as plt
from tensorflow.keras.datasets import mnist

# MNISTデータセットの読み込み
(x_train, y_train), (x_test, y_test) = mnist.load_data()

# 最初の25個の画像を表示する
fig, axes = plt.subplots(5, 5, figsize=(10, 10))
axes = axes.ravel()

for i in np.arange(0, 25):
    axes[i].imshow(x_train[i], cmap='gray')
    axes[i].axis('off')
    axes[i].set_title("Label: %s" % y_train[i], fontsize=12)

plt.subplots_adjust(hspace=0.5)
plt.show()
AI-CNN program
import numpy as np
import tensorflow as tf
from tensorflow import keras
from tensorflow.keras import layers

(x_train, y_train), (x_test, y_test) = keras.datasets.mnist.load_data()

x_train = x_train.astype("float32") / 255
x_test = x_test.astype("float32") / 255

x_train = np.expand_dims(x_train, -1)
x_test = np.expand_dims(x_test, -1)

y_train = keras.utils.to_categorical(y_train, 10)
y_test = keras.utils.to_categorical(y_test, 10)

model = keras.Sequential(
    [
        keras.Input(shape=(28, 28, 1)),
        layers.Conv2D(32, kernel_size=(3, 3), activation="relu"),
        layers.MaxPooling2D(pool_size=(2, 2)),
        layers.Conv2D(64, kernel_size=(3, 3), activation="relu"),
        layers.MaxPooling2D(pool_size=(2, 2)),
        layers.Flatten(),
        layers.Dropout(0.5),
        layers.Dense(10, activation="softmax"),
    ]
)

model.summary()

model.compile(loss="categorical_crossentropy", optimizer="adam", metrics=["accuracy"])

model.fit(x_train, y_train, batch_size=128, epochs=15, validation_split=0.1)

score = model.evaluate(x_test, y_test, verbose=0)
print("Test loss:", score[0])
print("Test accuracy:", score[1])
A program for judging handwritten digits using a mouse
#@title <font color='red'>DRAW APP</font> {vertical-output: true, run: "auto"}
import ipywidgets as widgets
import cv2
from io import BytesIO
from PIL import Image
from IPython.display import display, HTML
from google.colab.output import eval_js
from base64 import b64decode
from datetime import datetime
from termcolor import colored
import matplotlib.pyplot as plt
import numpy as np

Square_Size = 256 #@param ["256", "512"] {type:"raw"}
Brush_Size = 20 #@param {type:"slider", min:0, max:100, step:5}
filename = "your_name_here.jpg"

canvas_html = """
  <style>
    .colors-buttons div {
        width: 30px;
        height: 30px;
        margin: 1px;
        border: 1px solid black !important;}
    div {
        display: inline-block;
    }
    canvas{border:1px solid black !important;}
  </style>

  <canvas id="myCanvas" width="%d" height="%d"></canvas>

  <div>
    <button id="predict">Predict</button>
    <button id="clear">Clear</button>
  </div>

  <script>
  var canvas = document.querySelector('canvas')
  var ctx = canvas.getContext('2d')

  ctx.fillStyle = 'white';
  ctx.fillRect( 0, 0, canvas.width, canvas.height)
  var Brush_Size = %d

  var mouse = {x: 0, y: 0}

  var predictButton = document.querySelector('#predict')
  var clearButton = document.querySelector('#clear')

  canvas.addEventListener('mousemove', function(e) {
    mouse.x = e.pageX - this.offsetLeft
    mouse.y = e.pageY - this.offsetTop
  })
  canvas.onmousedown = ()=>{
    ctx.beginPath()
    ctx.moveTo(mouse.x, mouse.y)

    canvas.addEventListener('mousemove', onPaint)
  }
  canvas.onmouseup = ()=>{
    canvas.removeEventListener('mousemove', onPaint)
  }
  var onPaint = ()=>{
    ctx.fillStyle = 'black';
    ctx.fillRect(mouse.x-( Brush_Size/2), mouse.y-(Brush_Size/2), Brush_Size, Brush_Size)
    ctx.stroke()
  }

  clearButton.onclick = ()=>{
    console.log('Clearing Screen')
    ctx.fillStyle = 'white';
    ctx.clearRect(0, 0, canvas.width, canvas.height);
    ctx.fillRect(0, 0, canvas.width, canvas.height);
  }
  canvas.addEventListener('load', function() {
    console.log('All assets are loaded')
  })

  var dataJs = new Promise(resolve=>{
    predictButton.onclick = ()=>{
      resolve(canvas.toDataURL('image/jpeg'))
    }
  })

  </script>
  """


## Function to Appear Image Canvas
def draw(filename=filename,  w=Square_Size, h=Square_Size, Brush_Size=Brush_Size):
    display(HTML(canvas_html % (w, h, Brush_Size)))
    data_url = eval_js("dataJs")
    predict_job(data_url)


def predict_job(data_url):
    image_data = b64decode(data_url.split(',')[1])
    image = Image.open(BytesIO(image_data)).convert('L')
    preprocessed_image = preprocess_image(image)
    display_image(preprocessed_image)
    input_image = preprocessed_image.reshape(1, 28, 28)
    prediction = model.predict(input_image)
    predicted_digit = np.argmax(prediction)
    print("Predicted digit:", predicted_digit)
    plt.bar(range(10), prediction[0], tick_label=range(10))
    plt.xlabel("Digits")
    plt.ylabel("Probabilities")
    plt.title("Predicted probabilities for each digit")
    plt.show()

def preprocess_image(image, target_size=(28, 28)):
    image = image.resize(target_size, Image.ANTIALIAS)
    image_array = np.asarray(image)
    image_array = 255 - image_array
    return image_array / 255.0

def display_image(image_array):
    # 図のサイズを指定(単位はインチ)
    #plt.figure(figsize=(3, 3))
    plt.imshow(image_array, cmap='gray_r')
    plt.xticks([])
    plt.yticks([])
    plt.grid(False)
    plt.show()

## Show Canvas for the First Time
draw(filename=filename,  w=Square_Size, h=Square_Size, Brush_Size=Brush_Size)
Document
Japanese【日本語】
Comments